Monday, September 1, 2014

A House on NBA Island, Revisited

This article was originally published at Mid Level Exceptional on August 23, 2014.

Last month, in “The Value of a House on NBA Island”, I estimated the NBA franchise valuations for each of the 30 teams.  Steve Ballmer’s $2 billion purchase of the Los Angeles Clippers demonstrated that the oft-cited Forbes valuations badly undershoot the market price of a basketball team.  (Forbes had priced the Clippers at $575 million.)

My approach is based on a range of revenue multipliers which are partially determined by the team’s market size.  In finance, revenue multipliers capture the potential for future earnings growth; Netflix trades at a high multiple, while Delta Air Lines’ is low.  The methodology is simple, clear and grounded in the team’s ability to produce revenue.  The problem is that my multipliers are mostly guesswork and the ranges are wide for the big-market teams.  You do not need to read 1,000 words to know that the Knicks are probably worth between $2 and $4 billion.

Since then, the Clippers’ financials were entered as an exhibit in last month’s trial upholding Ballmer’s purchase of the team.  Bank of America, which advised the Sterling trust on the sale, created the report for potential buyers.  This “bid book” provides an opportunity to reground my model’s assumptions.

The report estimates that the Clippers earned $165 million in revenue this season and breaks it out into ticket sales, its local cable contract, revenue sharing and other sources.  Additionally, the Clippers’ value is also predicated on new expected revenue sources: new local cable and national TV contracts, both of which would begin in the 2016-17 season.  The latter is hotly anticipated, with both LeBron James and Lance Stephenson structuring their contracts to hit free agency the summer after the deal is signed and the salary cap (presumably) spikes.


In the most aggressive projections, the local cable contract would add $100 million per year to the team’s revenue and the national TV deal would add $60 million per year.  This implies that the national TV deal will be worth $2.7 billion per year since the teams get an equal share of national TV revenue.  Currently, the NBA generates $930 million per year from that source.

The present value of $160 million of revenue in the 2016-17 season is $129 million (I used a discount rate of 7.5% per year over three seasons to approximate B of A’s methodology.)  So if current plus future revenue is worth $294 million, then Ballmer paid 6.8 times earnings for the Clippers.  On a historical basis, this is high, but not nearly as lofty as the 15 times earnings that was initially reported (itself based on $128 million in revenue, last year’s number.)


With that said, these are very optimistic estimates and I suspect that Ballmer realizes that the Clippers are unlikely to double their revenue overnight from new TV deals.  According to the New York Times, the Clippers’ new local cable contract could be worth $60 million per year, adding $35 million in revenue annually.  Marc Ganis, president of Sports Corp Limited, thinks that the national TV deal will be worth between $1.75 and $2.1 billion per year.  If we use $2 billion, the Clippers’ share increases by $35 million, to $65 million.

If the Clippers gain $70 million from new local and national TV contracts, the present value of that money would be about $56 million.  Total current plus future revenue would be worth $221 million, meaning that the Clippers are worth 9 times earnings.


Using these improved estimates of future revenue growth, the valuations model can be fine-tuned, with narrower ranges of revenue multipliers.  Previously, the multipliers had been skewed by the incorrect conclusion that the Clippers were worth 15 times earnings.  As before, higher multipliers are used for teams in bigger markets since they benefit from greater national media exposure, ability to attract top free agents and prestige.


Even though we lack detailed revenue breakdowns for each team, this exercise can be extended to the whole league using similar assumptions:
  • Start with 2012-13 revenue, assume flat growth for simplicity
  • New national TV deal gives team $35 million in revenue in 2016-17 season
  • 2016-17 expected revenue is discounted at 7.5%/year over three seasons
The result is a set of NBA team valuations that fully incorporates the value of future TV rights while tightening the range of possible prices for large market teams.  The Knicks’ value now ranges between a more realistic $2.2 and $3.2 billion and the Lakers retain their status as the most expensive team in the league by a nose.  We will see how accurate these updated valuations are the next time that an NBA team changes hands.


Wednesday, August 13, 2014

The Albatross Calculator

This article was originally published at Batting Leadoff on August 13, 2014.

The MLB trade deadline is a natural time to assess the value of a player relative to his contract. Every July, FanGraphs’ Dave Cameron ranks the 50 most valuable players in baseball.  Unsurprisingly, stars like Mike Trout, whose WAR production is far more valuable than his salary, top the list.  Cameron’s rankings are somewhat subjective, but beautifully illustrate the concept of positive trade value.

This year, Cameron also wrote an article on negative trade value, where he estimates the amount of money a team would need to eat to move a large, unproductive contract.  He takes the difference between a guess of what the player would earn as a free agent this offseason and his current contract.  Again, it’s subjective but logical, and has all sorts of interesting applications (for example, could the Dodgers trade Matt Kemp plus valuable prospects for nothing in return, since they would offset each other?)

The cost of a win on the free agent market is the linchpin of trade value, whether positive or negative.  In the recent past, Cameron has estimated that teams pay $6 million per WAR in free agency.  So if Trout produces 8 WAR next season, when he’ll be paid $5.2 million, he’ll create over $43 million in surplus value for his team. However, each team values WAR differently based on its ability to spend (itself determined by market size and the owner’s wealth) and whether it’s trying to win now or later.  To make an extreme example, the Dodgers currently have a much higher valuation of WAR than the Astros, which is reflected in their payrolls.  Accounting for this factor is necessary to more accurately determine the cost of trading a player with negative value.

My model of negative trade value, or “Albatross Calculator,” incorporates an individual dollars-per-WAR estimate for each team, based on the ratio of the team’s opening day 2014 payroll to the median payroll.  It assumes that player salaries (and thus willingness to pay for wins) continue to increase by 3.5% per year, as they have over the past decade.


Then, it multiplies each team’s annual valuation of WAR, starting in 2015, by a player’s future anticipated WAR production (as estimated by Oliver).  Finally, it subtracts the cost of the remainder of the contract to determine the value of the player to his particular team. Let’s use B.J. Upton as an example.  He’s projected to produce 3.2 WAR over the remainder of his contract, and the Braves owe him $46.2 million.  They value 3.2 WAR at $21.5 million, giving Upton a value of negative $24.7 million in their eyes.


I used this methodology to evaluate the contracts of 40 players who are highly compensated relative to their level of production.  Before we jump in, a few caveats:
  • I built the list by eyeballing each team’s roster and salaries; don’t email me to complain that I left off your (least?) favorite albatross.
  • A team’s willingness to spend could change markedly in future seasons, which is very difficult to estimate.
  • Oliver estimates assume a full healthy season, and were created before the 2014 season.  When a player’s contract extends past 2018 (the last year of Oliver projections), I assume the player continues declining at a constant rate.  Also, I assume that a team will bench a player with negative WAR.
  • A discount rate on the value of future baseball contracts can’t be directly observed, so this factor is excluded.
Anyway, here’s the list:


The worst contracts shouldn’t surprise anyone: Albert Pujols, Prince Fielder, Josh Hamilton, Alex Rodriguez, and Ryan Howard are each worth less than negative $50 million to their team.  You might be surprised at just how bad the top two are, though: the Angels would pay up to $177 million to dump Pujols, while the Rangers would pay about $96 million to make Fielder someone else’s problem.  (This is after I factor in the $30 million of the Fresh Prince’s contract that Detroit is paying.)

The model perceives Justin Verlander, Brian McCann, and Elvis Andrus as having immense trade value, which in my opinion reflects on the shortcomings of Oliver projections.  They don’t bake in Verlander and McCann’s poor 2014 campaigns, and WAR tends to overvalue defense, where Andrus really shines.

Nevertheless, by estimating dollars-per-WAR at the individual team level, we observe that one’s man’s trash is another man’s treasure.  There are eleven players on the list, like Miguel Cabrera and Adrian Gonzalez, who have negative trade value when you value WAR at the market rate, but have positive value to their team.

This is why albatrosses tend to be traded to big-market teams: they can afford to take on a large contract, and also value WAR at a higher price than the team trading the player.  The Dodgers-Red Sox blockbuster deal in 2012, in which L.A. acquired Josh Beckett, Adrian Gonzalez, and Carl Crawford, is a great example.  The Dodgers were hungry to contend, and the Red Sox were looking to rebuild for future seasons.
We understand that you have to spend money to be good in this league. We understood that before we bought the team. So we're excited.


Magic Johnson, Dodgers co-owner
The Albatross Calculator uses this logic to predict whether a trade between two teams will happen, and how much money the team trading the albatross will have to eat.  For example, let’s say that the Mets want to trade Curtis Granderson to the Giants.  Since the Giants value Granderson’s future performance at negative $15 million, while the Mets value it at negative $29 million, the trade goes through with the Mets paying the Giants $15 million (or giving them players of similar value.)

But if the Mets want to trade Granderson to the Pirates, they would have to eat $31 million.  The Mets would prefer to keep Granderson in this situation, since he’s worth negative $29 million to them.  For the trade to happen under this model, the team acquiring the player has to have a higher valuation of WAR than the team trading the player (assuming that the teams have similar projections of the player’s future performance.)

Screen Shot 2014-08-12 at 2.42.16 PMScreen Shot 2014-08-12 at 2.42.25 PM             

If this model is correct, we arrive at a key conclusion: teams with a high dollars-per-WAR have limited ability to trade albatrosses.  For example, the Yankees value a win in 2014 at $12 million; only the Dodgers have a higher dollars-per-WAR, at nearly $14 million.  So unless the Dodgers have a screaming need for A-Rod or Mark Teixeira, or a smaller-market team has reason to believe that they will return to form, they will remain in pinstripes.

This makes the rebuilding process long and arduous for big-market teams, like the Phillies.  It helps explain why Ruben Amaro’s asking price for Cole Hamels was so high, and why they couldn’t dump any big contracts at the trade deadline.  The Phillies and Yankees will either have to adjust their value of a win downward (i.e. give up on this/next season and contend in later years) or wait for long contracts to expire.

Try out the Albatross Calculator for yourself below - just pick a player and new team!

Friday, July 25, 2014

Bartolo Colon, Mr. Consistent

This article was originally published at Batting Leadoff on July 25, 2014.

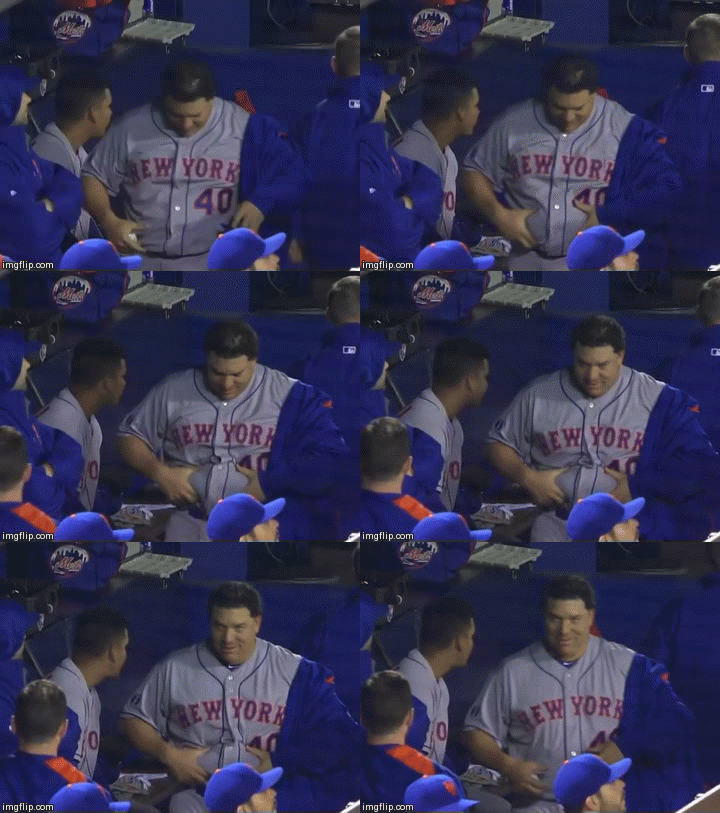
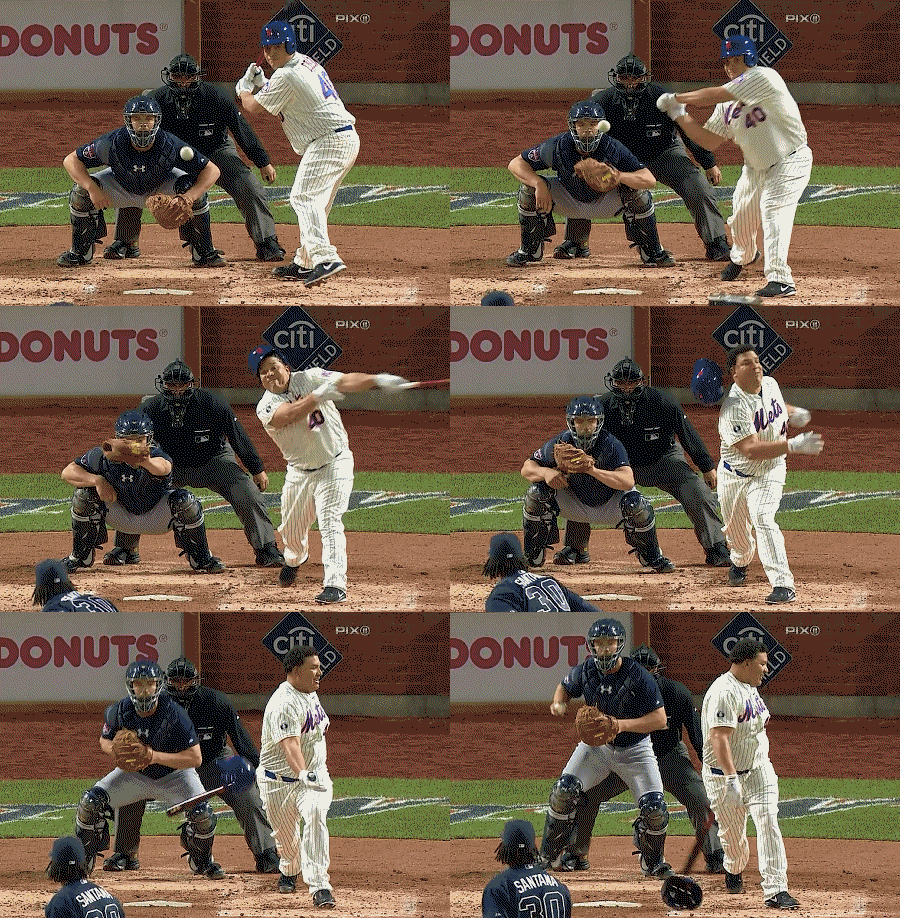
Bartolo Colon is the Rodney Dangerfield of baseball: he don’t get no respect. Despite an impressive late-career resurgence, baseball fans know Colon best for his, uh, generous proportions. The 285-pound pitcher is a frequent target of mockery on Twitter and Deadspin; his celebratory post-game belly shake is undoubtedly the baseball GIF of the year, though Colon whiffing and losing his helmet while at bat is also a strong contender.


Colon has gotten the last laugh, though: after undergoing experimental stem-cell therapy in 2010, he’s reinvented himself as a durable, innings-eating workhorse. He has posted a sub-4.00 FIP every subsequent season, providing value as a starting pitcher for the Yankees, Athletics, and now the Mets. Even after a 50-game suspension for testosterone use in 2012, he had his best-ever season (in terms of ERA and FIP) in 2013. The Mets signed Colon to a two-year, $20 million contract last offseason, and have been rewarded with a solid year so far. His FIP is 3.50, and yesterday, he had a perfect game going through 6 2/3 innings. Had he achieved the perfecto, I think the Internet might have broken.
So what’s the secret to his success? First, Colon issues very few walks. His BB/9, already stingy at 1.56 from 2011-14, has fallen to 1.28 this season, good for fifth-best among qualified starters. This, combined with a respectable 6.72 K/9 this season, has resulted in a 5.26 K/BB ratio. At tenth-best this season among qualified starters, this ratio puts him in the same territory as strikeout machines like Stephen Strasburg and King Felix.


Second, Colon’s fastball, while not particularly fast (89 mph), is accurate and has movement. He’s well known for heavy reliance on his fastball, throwing it 82% of the time this season, more than anyone else. But according to his catchers, he throws at least five different kinds of fastball, including a two-seamer and a cutter. His pitches, especially his two-seamer, have high lateral motion; it breaks even more than his changeup does. But he still keeps half of his pitches in the strike zone, sixth-best in baseball.

Screen Shot 2014-07-24 at 1.09.31 AM

Third, he pitches deep into games and misses few starts. His size and age would make him seem like a likely candidate for a long DL stint, yet he’s thrown 639 innings over 100 starts during the past four seasons, putting him in the top 50 during that time period. His average of 6 2/3 innings per game is fourth-best in the National League among pitchers with at least 10 starts. Colon’s ability to throw strikes, avoid breaking balls, and get hitters out using control and deception rather than blistering speed may give him durability. Together, these three factors combine to create consistently solid performance. He’s not Clayton Kershaw, but he gives you 175-200 innings of average to above-average ball per season, depending on your definition of FIP. Not many 41-year-olds can do that.


With the Mets likely out of the playoff hunt, the front office is shopping him to the Orioles, Mariners, Giants, and others, with the hopes of garnering a shortstop or power-hitting outfield prospect in return. The Mets have a deep, young starting rotation, and Colon is unlikely to make a big contribution when the team (hopefully) contends in 2015 and beyond. So far, teams in the pennant chase have not exactly hurried to acquire Colon. Before Wednesday’s start, he had had a rough July, with an ERA of 5.40 and zero wins. But his slump mostly reflected bad defense rather than deteriorating ability. His FIP during the same timeframe was 3.29 (making July his best month this season), and his velocity, which declined down the stretch in 2013, has not fallen this year.

Screen Shot 2014-07-24 at 1.10.18 AM 

If, in Jim Bowden’s estimation, Bartolo Colon was worth a “good, upper-level prospect” in June, then the same should be true now also.  As a fan of humorous baseball GIFs, I hope he stays in the National League where he can continue to bat.

Thursday, July 17, 2014

New Faces, New Places: Lance Stephenson Signs With Charlotte Hornets

This article was originally published at Mid Level Exceptional on July 16, 2014. 

The Player: Lance Stephenson

The Team: Charlotte Hornets

The Contract: Three years, $27.5 million; $9 million in Years 1 and 2, $9.5 million in Year 3; team option for Year 3

First Take: Charlotte has to be very happy with snapping up one of the last major free agents on the market at a bargain. The Hornets were prepared to pay Gordon Hayward $63 million over four years before Utah matched their offer sheet. Stephenson, a much stronger defender, had a win share of 7.4 last season, compared to 3.6 for Hayward. At the beginning of the offseason, Stephenson turned down a five-year, $44 million offer from the Pacers, calling it a “low-ball offer”. But the Hornets’ contract is marginally higher per year, and his agent suggested that Stephenson was more motivated by dissatisfaction with his situation on the Pacers. It seems that Stephenson’s mercurial behavior drove down his value; Dallas would have offered him two years and $20 million had Houston matched their offer for Chandler Parsons. With that said, Business Insider points out that Stephenson may benefit by becoming a free agent after the 2016-17 season, when a new TV deal is projected to substantially increase player salaries. He takes on some risk now for potential reward down the road.

How does it affect the salary cap? Charlotte had quite a bit of cap space going into free agency, with only about $43 million in salaries and holds, according to ShamSports. But the signings of Marvin Williams ($7 million/year), Brian Roberts ($2.75 million/year), and now Stephenson brings them within $1.5 million of the $63.2 million salary cap, assuming cap hits equal to average annual value.


How does it affect the luxury tax? The Hornets are very unlikely to approach the $77 million luxury tax threshold next season.

What’s next for Charlotte? Charlotte is still in need of size off the bench with the departure of Josh McRoberts, and could use a backup point guard to Kemba Walker. Between their remaining cap room and the mid-level exception ($2.58 million for teams below the salary cap), they’ll try to make these upgrades on the cheap.

Sunday, July 13, 2014

The Value of a House on NBA Island

This article was originally published at Mid Level Exceptional on July 3, 2014.

In a recent article at Grantland, Bill Simmons compared NBA franchises to beachfront property on an exclusive island, with space for only 30 glamorous houses. Unlike most assets, which one buys because of their ability to generate profit, the value of a sports franchise is primarily derived from its scarcity and the fact that very wealthy people find them fun to own (see Cuban, Mark). This is why Forbes valuations, which try to assess the value of sports franchises based on their underlying financials, consistently undershoot the teams’ sale prices.

Simmons argues that the owner-friendly 2011 collective bargaining agreement and the NBA’s growing international popularity have made franchises far more valuable over the past few years. I would add that the rapidly increasing value of TV broadcast rights also factors in, since sports are the rare TV property that everyone wants to watch live. Finally, the growing concentration of wealth has created more potential franchise buyers, with deeper pockets than ever.

Whatever the reasons, six NBA teams were sold in 2010 and 2011 for an average of $410 million, while more recent sales of the Sacramento Kings ($534 million) and the Milwaukee Bucks ($550 million) set records. It should be noted that the Kings and Bucks have very weak rosters, play in small markets, and have outdated arenas.

Steve Ballmer’s purchase of the Los Angeles Clippers for $2 billion underscores Simmons’ argument. Ballmer paid an eye-popping 15 times revenue ($128 million in 2013, according to Forbes) to own a team that, though an NBA laughingstock for most of its history, plays in the second-largest market and is a championship contender. Forbes had pegged the Clippers’ value at a mere $575 million.

However, I think Simmons goes a bit far when he says “…you can’t rationally assess the ‘value’ of anything when ego is involved.” Ultimately, there’s a limit on what even the most passionate ultra-wealthy NBA fan is willing to pay, and that limit is at least partially determined by the team’s ability to create revenue. Because of this, it’s possible in theory and in practice to model the value of NBA teams.

Aswath Damodaran, of the blog Musings on Markets, takes a stab at pricing the Clippers from a financial perspective. He discusses a few different measures of valuation, the most compelling of which (in my opinion) is based on the multiple of the team’s revenue. It’s a quick and dirty method, but is logical and easy to extend to other teams.

Nate Silver of FiveThirtyEight presents an alternate view. He found a correlation between the annualized rate of increase in a team’s Forbes valuation and the number of Fortune 400 billionaires in the team’s metro area, and used the coefficients to generate a range of estimated prices for each team. Though this method is inventive, the correlation exists because metro areas with more billionaires are also larger markets with more fans. It’s not as though billionaires only want to buy the team located in their city; Wesley Edens and his co-owner Marc Lasry are not from Milwaukee, nor do they intend to live there. Though Brooklyn has a heavy Russian population, Mikhail Prokhorov had no ties to the area before purchasing the Nets.

My valuation approach is thus based on Damodaran’s revenue multiplier methodology, but I use multiples that reflect the size of the team’s market, rather than just the average of recent sale prices. A big-market team with $200 million in revenue is worth more than twice a small-market team with $100 million in revenue. Consider the advantages that teams in major markets have:
  • National media exposure: Marquee teams are frequently featured on national TV. This season, the Knicks, Lakers, Bulls, Clippers, and Nets played in nearly one-third of the nationally televised games, while 15 teams played five times or less (of which only two play in major markets.)
  • Free agency: Glamorous cities can appeal to top free agents, many of whom aspire to celebrity status and seek to build a global brand. This helps explain why LeBron James took his talents to South Beach, rather than Sacramento. Rules capping maximum player contracts make it difficult for a small-market franchise to counteract this advantage.
  • Prestige: Being the owner of a storied franchise in a major city, like the Lakers or Knicks, gives you a certain cache that doesn’t come with owning a team in a small city. When was the last time you saw Jack Nicholson or Jerry Seinfeld sit courtside at a Timberwolves game?
With this in mind, I came up with three tiers of revenue multiples: one range of multiples for small markets, one for medium-sized markets, and one for large markets. I approximate market size by the population of each team’s MSA.


The following range of estimates of each team’s value are based on these multiples and each team’s 2013 revenue:
 

The Clippers’ value comes out to somewhere between $960 million and $1.9 billion; there’s no way around the fact that Steve Ballmer paid a pretty penny for the team. But when you have $18 billion in your bank account, you probably don’t care about overpaying by at least $100 million. A few other interesting takeaways:
  • The Lakers are the most valuable team in the NBA, with a median price of nearly $3 billion. The Knicks are right behind them at $2.9 billion. If they were sold at 15 times revenue, as the Clippers were, their sticker prices would exceed $4 billion.
  • The Spurs are the most valuable small-market team ($670 million to $1 billion), while the Heat are the most valuable medium-market team ($940 million to $1.9 billion). Nike was right; winning does take care of everything.
  • Fourteen teams have median estimated values of $1 billion or more.
  • The Philadelphia 76ers are the cheapest big-market team, with their value ranging between $880 million and $1.75 billion. This is unsurprising, as their low revenue is linked to their unsightly performance over the past few seasons.
One caveat, here: this is far from the be-all, end-all valuation of sports franchises. A more thorough valuation methodology would include multiple years of team revenue, account for other relevant factors that are only loosely related to team revenue (quality of roster, age of stadium), and could have different definitions of market size and revenue multipliers. So if you’re a billionaire who’s dying for an NBA team, consult with a good investment banker and your lawyer before you plunk down $930 million for the Denver Nuggets.

Wednesday, June 18, 2014

Nelson Cruz, Cruisin' No More?

This article was originally published at Batting Leadoff on June 18, 2014.

Nelson Cruz may be the most hated man in the sabermetrics community.

It’s no secret that baseball analysts dislike aging sluggers coming off of a PED suspension. Cruz is one-dimensional: last season, he hit 27 HR with a .506 SLG (putting him in the top 20 of players with >250 PA), but is a butcher on defense (UZR/150 of -6.5) with poor plate discipline (in 2013, he swung at 30.8% of pitches outside the strike zone) and an unsightly walks-to-strikeout ratio (0.32 BB / K).

Last offseason, Cruz was deemed “the biggest land mine of the 2014 free agent class” and “perhaps the most overrated player in baseball” by FanGraphs’ Dave Cameron. In "A Frightening List of Nelson Cruz Comparisons", Cameron compared Cruz to a historical peer group of declining power hitters, and questioned the sanity of any front office willing to give him a multiyear contract. I almost expected to read that Nelson Cruz kicks puppies and backhands small children across the face for amusement.

So it comes as a surprise that Nelson Cruz is having an excellent offensive season with the Baltimore Orioles. He leads MLB with 21 homers, despite hitting only one in June. His .605 slugging percentage is third-best in baseball, his .301 ISO is fourth-best, and his wRC+ of 165 is eighth-best. Cruz is making the O’s look savvy for signing him to a low-risk one-year, $8 million contract.

But Cruz’s surge has abruptly short-circuited over the past two weeks, as his lone June homer would indicate. His OBP for June is .339, down from .383 during April and May. His power has totally cratered, from an ISO of .360 in April and May to .075 this month. Though he has 14 hits this month, only two have gone for extra bases. Orioles fans are left wondering why Cruz tore the cover off the ball in April and May, and why he’s underperforming this month.

Cruz’s offensive explosion in April and May didn’t coincide with a new approach at the plate. If anything, he became a more reckless swinger: his O-Swing (% of pitches swung at outside the strike zone) rose to 32.9%, while his O-Contact (% of pitches that batter makes contact with when swinging) fell to 51%. He made up for this by swinging at and making contact with more pitches in the strike zone. Unsurprisingly, his strikeouts remained high.


Cruz’s ability to hit fly balls, a good predictor of home runs, hasn’t changed either. His share of batted balls in the air, around 45% during April and May, lines up with his recent career average.


Part of why Cruz is hitting more bombs without putting a greater share of balls in the air is that his volume of hits is up from 2013. He’s also walking a little more and striking out a little less.


But what jumps off the page is his share of fly balls that have left the park: an otherworldly 28.6% in April and May. For comparison, Miguel Cabrera’s HR/FB during his 2012 Triple Crown season was 23%. Granted, Cruz’s HR/FB has always been high, but it’s unrealistic to expect him to maintain such a high homer-to-fly ball ratio all season.


The same information also sheds some light on his recent slump. In June, Cruz’s HR/FB ratio has been way below his career average, and he has hit more line drives and fewer fly balls. A quarter of the fly balls he does hit are landing harmlessly in the infield.


Cruz is reacting by doing what he does best: swinging more. He is swinging and making contact a little more often at pitches both inside and outside of the strike zone. He’s also punching out more.


He’s also swinging at more off-speed and breaking pitches, which is troubling since his ability to hit off-speed stuff for power has declined over the past few seasons.


Whether this represents regression, a garden-variety slump, or pitchers approaching Cruz differently is hard to say, given that we’re talking about only 15 games. I’m inclined to believe that his power will revert to the numbers he’s put up in the past few seasons, since his HR/FB ratio and batted ball distributions are so far off his recent career trends.

The sabermetricians are correct to be on Nelson Cruz’s case, and it doesn’t make sense to sign older power hitters to long, lucrative contracts. Regardless, Orioles fans have to be happy with the unexpectedly high level of production they’ve gotten from Cruz this season. Despite his poor hitting over the past two weeks, both the ZiPS and Steamer projection systems expect him to regain his power stroke over the rest of the season.


With that said, O’s fans who expect Cruz to have a Chris Davis-like home run chase based on his play in April and May will probably be crushed.

Tuesday, May 20, 2014

Jose Abreu, the Cuban Ichiro

This article was originally posted on Batting Leadoff on May 19, 2014.

They couldn’t be any more different.

Jose Abreu, the Chicago White Sox’s rookie first baseman and reigning AL Player of the Month, is on a power-hitting rampage.  At six-foot-three and 255 pounds, the Cuban sensation looks like a man who was born to hit moonshots; he leads MLB with 15 home runs in only 42 games.

Ichiro is the greatest Japanese-born player in MLB history.  Lithe and trim, the mononymous outfielder is celebrated for his tremendous speed, defense, and volume of hits.  As a rookie in 2001, Ichiro led baseball in hits and stolen bases, and was MVP of the American League.  Three years later, he set the MLB record for most hits in a season.

Not much in common, you might think.  But there are two reasons that Abreu and Ichiro belong in the same sentence. 

First, Abreu, like Ichiro, is having a transcendent rookie season after stardom in a non-American league.  He stands out among a wide range of competitor sets:
  • Cuban stars in MLB: Nobody doubts that Yoenis Cespedes and Yasiel Puig can mash, but through their first 42 games, Abreu has outshined them both.
 
  • MLB in 2014: Abreu leads all batters in home runs, total bases, and AB/HR.  He leads the American League in slugging percentage and isolated power.
 
When a rookie is on pace for 58 HR and 158 RBI, one naturally wonders about regression.  It’s a legitimate concern (remember Kevin Maas?), and his nagging ankle injury has landed him on the 15-day DL, and could make him less effective as the season wears on.

But Abreu is unusually well scouted for a Cuban player, belying his reputation as an unknown commodity.  His BABIP of .286 puts him in the bottom half of starting first basemen.  Most importantly, he can hit outside pitches to the opposite field.  As MLB Daily Dish’s Jasper Scherer points out, “[The] ability to go the other way is key for maintaining success as a power hitter, as big-league pitchers inevitably find ways to exploit hitters who can only pull the ball for power – a la Curtis Granderson.”

Source: FanGraphs

Abreu will cool off at some point, but it should be evident by now that the man can rake.  He or Masahiro Tanaka will be the AL Rookie of the Year.

The second similarity between Ichiro and Jose Abreu is somewhat more speculative, but more meaningful for the future of baseball. Ichiro was not the first Nippon Professional Baseball (NPB) player to permanently break into MLB, but his 2001 MVP campaign removed all doubt that Japan’s best players could excel on baseball’s highest stage.  Since then, Hideki Matsui, Yu Darvish, and Masahiro Tanaka have made the leap to MLB stardom, and teams have signed more Japanese players, as the chart below indicates.


Cuban-born stars in MLB are nothing new.  El Duque broke into the majors 15 years ago, and even casual baseball fans are aware of Aroldis Chapman, Jose Fernandez, and some kid who likes bat-flipping.  This season, there are 19 MLB players from Cuba; every front office knows that Serie Nacional (the island’s top league) has talent.

But if Jose Abreu’s dominance continues, I think that teams will accelerate their pursuit of Cuban stars, just as front offices looked to Japan for the next Ichiro-caliber star.  The Abreakout coincides with two other developments that make this outcome likely.

First, the Cuban government recently allowed its players to play in foreign professional leagues during the spring and summer, Serie Nacional’s offseason.  As Cuban players migrate to the Mexican League and NPB, they will have more exposure to AAA-level competition (Serie Nacional is considered equivalent to high-A ball), as well as to MLB scouts.  The Cuban government is hoping that letting players earn a salary overseas will discourage them from defecting, but with 30 MLB teams able to scout these players and open their wallets accordingly, this seems like wishful thinking to me.

So far, only three Cuban players have moved to overseas leagues under the new law.  The Mexican League, under pressure from Minor League Baseball to avoid running afoul of the U.S. embargo on Cuba, requires Cuban players to have residency in another country.  But it’s easy to imagine this rule changing; MLB history shows that teams will do anything for a competitive advantage, whether laudable or shady.  The more Cuban players who play overseas, the more who will obtain residency in Mexico or Japan and become eligible for MLB free agency.

Second, the current CBA creates strong incentives for MLB teams to seek out talent abroad.  It awards fewer compensatory draft picks, and imposes severe financial penalties for drafting over slot.  But as Batting Leadoff’s Max Fogle points out, the sanctions for exceeding MLB’s spending limits on international amateurs are comparatively weak.  Consequently, the Cubs, Yankees, and Rangers have spent aggressively on international amateurs in recent years.  Additionally, Cuban players who are 23 or older and have played at least three seasons in Serie Nacional are considered free agents, exempt from all spending caps.  Whether Cuban players enter MLB as free agents or international amateurs, their pursuit remains an area where big-market teams can flex their muscles.

Jose Abreu, like Ichiro, is having a monster rookie season.  If many more Cuban stars, like Alfredo Despaigne, take their talents to MLB, they will be able to say that Jose (and Yasiel, and Yoenis…) led the way.

Wednesday, May 7, 2014

Modeling Future Contract Extensions

This article was cross-posted on FanGraphs Community on April 22, 2014, and was selected by the site's editors as one of the best posts of the week.

Last month, Dave Cameron published a brilliant yet simple free-agent pricing model. Using only projected 2014 WAR (ZiPS and Steamer projections are averaged) and the assumption that one incremental win is worth $5 million, it accurately projects the contract length and cost of last offseason’s free agents. Cameron also made some minor tweaks to his model to project 2015 free agent contracts. Both articles are absolutely worth checking out in full.

It’d be fun and easy to extend Cameron’s model to predict what David Price (2016), Chris Davis  (2016), and Giancarlo Stanton (2017) would make on the free agent market. (If you’re curious, Price would get 6/$136, Crush would get 6/$112, and Stanton would get 9/$260, assuming that the value of an incremental win increases annually by $500,000.)

But the recent slate of massive contract extensions illustrates the folly of this exercise. Savvy front offices lock up top talent before it hits free agency, usually at a discount relative to the free agent market. Young players often prefer an immediate certain payday rather than rolling the dice in free agency, when their future value will be far more unpredictable. A model that predicts the value of contract extensions would thus be a useful counterpart to the free agent pricing model. You’re in luck, because I just built one.

I kept the basic contours of Cameron’s model in place; as before, the only inputs are projected 2014 WAR and an estimated value of an incremental win. This gives us the contract length (projected 2014 WAR times a multiplier that scales up depending on the WAR projection) and average annual value (projected 2014 WAR times $5 million).

To test the accuracy of this approach, I compared the extension model’s output to 32 contract extensions that have been signed since July 1, 2013. I excluded players projected to produce less than 1 WAR this season. I estimated the value of an incremental win produced by a closer as $10 million, which lines up with what closers earned in free agency last offseason. If a player’s extension kicks in after the 2014 season, I counted the remainder of his current contract as part of the extension.

Free Agent Model vs. Actual Contracts

PlayerTeam2014 WARProj YrsProj AmountProj AAVAct YrsAct AmountAct AAV$/WAR
Mike TroutAngels8.617$731$437$146$21$2.4
Miguel CabreraTigers6.012$357$3010$292$29$4.9
Clayton KershawDodgers4.78$186$237$215$31$6.6
Dustin PedroiaRed Sox4.69$207$238$110$14$3.0
Andrelton SimmonsBraves4.59$200$227$58$8$1.9
Jason HeywardBraves4.18$164$212$13$7$1.6
Matt CarpenterCardinals3.67$126$186$52$9$2.4
Freddie FreemanBraves3.57$121$178$135$17$4.9
Jason KipnisIndians3.57$121$176$53$9$2.5
Ian DesmondNationals3.26$95$162$18$9$2.9
Jose QuintanaWhite Sox3.15$78$165$27$5$1.7
Starling MartePirates3.16$92$156$31$5$1.7
Chase UtleyPhillies3.04$59$152$25$13$4.2
Coco CrispA’s3.04$59$153$30$10$3.4
Yan GomesIndians3.04$59$156$23$4$1.3
Brett GardnerYankees2.84$55$145$58$12$4.2
David OrtizRed Sox2.72$27$142$31$16$5.7
Jordan ZimmermannNationals2.74$54$142$24$12$4.4
Jedd GyorkoPadres2.74$54$146$35$6$2.2
Homer BaileyReds2.64$51$136$105$18$6.9
Hunter PenceGiants2.44$48$125$90$18$7.5
Julio TeheranBraves2.33$34$116$32$5$2.4
Tim LincecumGiants2.02$20$102$35$18$9.0
Will VenablePadres1.92$19$92$9$4$2.3
Jose AltuveAstros1.92$19$94$13$3$1.7
Craig KimbrelBraves1.87$123$184$42$11$6.0
Ryan HaniganRays1.62$16$83$11$4$2.3
Michael BrantleyIndians1.62$16$84$25$6$4.0
Chris ArcherRays1.52$15$86$26$4$2.9
Martin PerezRangers1.52$15$84$13$3$2.2
Charlie MortonPirates1.41$7$73$21$7$5.2
Glen PerkinsTwins1.04$40$104$22$6$5.5


The initial results are mixed. The model comes very close to the actual average extension contract length (prediction of 5.1 years vs. actual of 4.8 years), but badly overshoots the actual AAV. Again, this is because GMs pay more for a win on the free agent market than for a win produced by a player already on their roster. To account for this, I set the value of an incremental win at $3.7 million, the average WAR / $ of the 30 non-closers’ contract extensions. (For closers, I used $7.4 million.)

Extension Model vs. Actual Contracts

PlayerTeam2014 WARExt YrsExt AmountExt AAVAct YrsAct AmountAct AAV$/WAR
Mike TroutAngels8.617$541$327$146$21$2.4
Miguel CabreraTigers6.012$264$2210$292$29$4.9
Clayton KershawDodgers4.78$138$177$215$31$6.6
Dustin PedroiaRed Sox4.69$153$178$110$14$3.0
Andrelton SimmonsBraves4.59$148$167$58$8$1.9
Jason HeywardBraves4.18$121$152$13$7$1.6
Matt CarpenterCardinals3.67$93$136$52$9$2.4
Freddie FreemanBraves3.57$89$138$135$17$4.9
Jason KipnisIndians3.57$89$136$53$9$2.5
Ian DesmondNationals3.26$70$122$18$9$2.9
Jose QuintanaWhite Sox3.15$57$115$27$5$1.7
Starling MartePirates3.16$68$116$31$5$1.7
Chase UtleyPhillies3.04$44$112$25$13$4.2
Coco CrispA’s3.04$44$113$30$10$3.4
Yan GomesIndians3.04$44$116$23$4$1.3
Brett GardnerYankees2.84$41$105$58$12$4.2
David OrtizRed Sox2.72$20$102$31$16$5.7
Jordan ZimmermannNationals2.74$40$102$24$12$4.4
Jedd GyorkoPadres2.74$40$106$35$6$2.2
Homer BaileyReds2.64$38$96$105$18$6.9
Hunter PenceGiants2.44$36$95$90$18$7.5
Julio TeheranBraves2.33$25$86$32$5$2.4
Tim LincecumGiants2.02$14$72$35$18$9.0
Will VenablePadres1.92$14$72$9$4$2.3
Jose AltuveAstros1.92$14$74$13$3$1.7
Craig KimbrelBraves1.87$91$134$42$11$6.0
Ryan HaniganRays1.62$12$63$11$4$2.3
Michael BrantleyIndians1.62$11$64$25$6$4.0
Chris ArcherRays1.52$11$66$26$4$2.9
Martin PerezRangers1.52$11$64$13$3$2.2
Charlie MortonPirates1.41$5$53$21$7$5.2
Glen PerkinsTwins1.04$30$74$22$6$5.5


With the adjustment to $/WAR, the results look much better. The predicted average AAV ($11.3 million) is now only 6% higher than the actual average ($10.6 million.) For the 31 players on the list (excluding Mike Trout, an outlier if there ever was one), the model projects a total of 147 years and $1.87 billion in contracts; the actual sums are 146 years and $1.67 billion. Not perfect, but decent.

The model misses very badly for unusual situations. Jason Heyward and Ian Desmond are projected as 8/$121 and 6/$70 respectively, but they both signed 2 year contracts worth less than $20 million last offseason. Both players were unable to come to terms with their teams on longer deals. This is probably because they are the odd men out on teams that have either just made it rain on prodigious young talent (Kimbrel, Freeman, Simmons) or will do so in the near future (Strasburg, Harper). Instead, Heyward and Desmond opted for shorter contracts in order to avoid arbitration and set themselves up for 2016 free agency.

Mike Trout is a unique case. The fishy outfielder signed a 7 year, $146 million extension last month, which looks like a massive underpay compared to the 17 years, $541 million (!!!) the model says he is worth. Don’t get me wrong: for the Angels, the Trout signing is still the best deal since the Louisiana Purchase. But it’s unrealistic to conclude that the Angels saved $395 million, since nobody would wait until Chelsea Clinton’s second term to test free agency, least of all someone who is currently breaking baseball.

Despite these shortcomings, the model can still evaluate the wisdom of recent extensions. Plotting the 32 players on a 2×2 matrix (the x-axis is the difference between actual and projected AAV, and the y-axis is the difference between actual and projected contract length) shows which front offices overpaid and which got steals.

Scatterplot of Contract Extensions


The extensions fall into four groups: locked-in bargains, short-term bargains, “win now” splurges, and albatrosses.
  • Locked-in bargains are the best kind of extension: these contracts are cheap and relatively long. Yan Gomes is a good example; the model thinks he’s worth $11 million a year for 4 years, but the Indians locked him down for $4 million a year for 6 years. Initially, I felt bad that Yan missed out on an extra $20 million, but then I remembered that he’s a millionaire in his mid-20s who probably sleeps well at night, whereas I am a non-millionaire in his mid-20s who does not play a sport for a living.
  • Short-term bargains are contracts that are cheap but shorter than projected. According to the model, Andrelton Simmons is worth $16 million a year for 9 years; the Braves signed him for $8 million a year for 7 years. So the Braves paid a below-market AAV for Simmons, but deprived themselves of controlling him for two more years (at least in theory). One caveat here: as explained earlier, Heyward and Desmond fit into this quadrant because their teams were unwilling to pay out for longer contracts, and Trout is simply a freak show.
  • Win now splurges are contracts that are expensive but relatively short. Clayton Kershaw fits here because he makes $14 million more per year than the model thinks he deserves, but has a 7 year contract rather than the 8 years the model would give him. One could argue that Kershaw is a potential albatross, but if he leads the Dodgers to a World Series this year, their fans, like the Honey Badger, won’t care.
  • Albatrosses are exactly what they sound like: excessively long, pricey contracts that make fan bases cry. Hunter Pence and Homer Bailey are the biggest albatrosses on the list; they were paid an extra $42 million (Pence) and $67 million (Bailey) than the model says they’re worth. Miguel Cabrera really belongs in this quadrant as well. The model considers Miggy a win now splurge, but only because it thinks he deserves 12 years rather than 10. No, Tigers fans, Mike Ilitch did not help me build this model.

Finally, the model can estimate how much your team should pay to extend your favorite young star.

Extension Model for 2015-18 FAs under 30 with WAR > 2

PlayerFA YearAge in 20142014 WARExt YearsExt AmountExt AAV
Yu Darvish2018275.19$168$19
Giancarlo Stanton2017244.59$148$16
Max Scherzer2015294.68$136$17
Jason Heyward2016244.18$121$15
Carlos Gomez2017284.08$117$15
David Price2016284.27$109$16
Pablo Sandoval2015273.77$95$14
Chase Headley2015293.67$92$13
Carlos Gonzalez2018283.57$91$13
Chris Davis2016283.57$89$13
Brett Lawrie2018243.47$88$13
Stephen Strasburg2017253.56$78$13
Carlos Santana2018274.05$73$15
Jay Bruce2018273.26$70$12
Ian Desmond2016283.26$70$12
Matt Wieters2016273.65$67$13
Justin Masterson2015293.15$56$11
George Springer2019243.05$56$11
Jason Castro2017263.24$47$12
Jonathan Lucroy2018273.24$47$12
Brandon Belt2018252.84$41$10
Desmond Jennings2018272.84$41$10
Jordan Zimmermann2016272.74$40$10
Colby Rasmus2015272.74$40$10
Yoenis Cespedes2018282.74$39$10
Pedro Alvarez2017272.74$39$10
Eric Hosmer2018242.64$38$10
Johnny Cueto2016282.23$24$8
Yovani Gallardo2016282.13$23$8
Billy Butler2016272.13$23$8
Jed Lowrie2015292.13$23$8
Brandon Morrow2016292.13$23$8
Asdrubal Cabrera2015282.13$23$8

To return to our earlier examples, Chris Davis would get 7 years and $89 million, David Price would get 7 years and $109 million, and Giancarlo Stanton would get 9 years and $148 million if they signed extensions this season. Of course, it’s tough to predict who will sign an extension and who will try their luck in free agency. Build me a model that can do that, and I’ll eat my Mets hat.